
Three in Four Female Chess Players Faced Gender Bias or Harassment: FIDE Survey, and a Number Without a Denominator
**मुख्य उत्तर**: FIDE के एक सर्वेक्षण के अनुसार चार में से तीन महिला शतरंज खिलाड़ियों ने जेंडर पक्षपात या उत्पीड़न की शिकायत की है, यानी लगभग 75 प्रतिशत। सर्वेक्षण की नमूना संख्या, प्रश्नावली और फील्डिंग अवधि सार्वजनिक सामग्री में नहीं दी गई है, इसलिए आंकड़ा दिशात्मक रूप से मजबूत पर सटीकता में असत्यापित है। **मुख्य तथ्य**: - FIDE सर्वेक्षण के मुताबिक चार में से तीन महिला शतरंज खिलाड़ियों ने पक्षपात या उत्पीड़न झेला है। - सर्वेक्षण में नमूना आकार, प्रश्न का शब्द-क्रम, फील्डिंग तिथि और भौगोलिक दायरा सार्वजनिक नहीं किया गया। - सुर्खी "पक्षपात या उत्पीड़न" को एक वियोजक प्रश्न में जोड़ती है, जिससे संस्कृति और सुरक्षा समस्याएं अलग नहीं होतीं। - ऐतिहासिक रूप से 50 से कम महिलाओं ने पूरा ग्रैंडमास्टर खिताब हासिल किया है, जो सभी GMs का 2 प्रतिशत से कम है। - शीर्ष महिला खिलाड़ियों और विश्व नंबर एक के बीच अनुमानित 230–280 एलो का अंतर रहा है। **स्रोत**: FIDE सर्वेक्षण रिपोर्ट का द्वितीयक उल्लेख; प्राथमिक दस्तावेज़, प्रकाशन तिथि और पद्धति सार्वजनिक सामग्री में उपलब्ध नहीं। **संबंधित प्रश्नोत्तर**: प्रश्न: FIDE सर्वेक्षण का 75 प्रतिशत आंकड़ा कितना विश्वसनीय है? उत्तर: दिशा में विश्वसनीय, परिशुद्धता में नहीं — नमूना संख्या और फील्डिंग विवरण के अभाव में यह असत्यापित है और इसे "कम से कम इतना" की तरह पढ़ा जाना चाहिए। प्रश्न: इस आंकड़े में पक्षपात और उत्पीड़न को एक साथ क्यों जोड़ा गया है? उत्तर: वियोजक प्रश्न से एक ही प्रतिशत बनाया गया, जिससे आयोजक यह तय नहीं कर सकते कि उनके सामने संस्कृति की समस्या है या सुरक्षा की, और दोनों के इलाज पूरी तरह अलग हैं। प्रश्न: शतरंज में महिलाओं के प्रदर्शन पर इसका असर कैसे मापा जा सकता है? उत्तर: लिंग के हिसाब से टूर्नामेंट छोड़ने की दर, भागीदारी की निरंतरता, समय-दबाव में त्रुटि-दर और आयु-समूह के हिसाब से ड्रॉपआउट मापकर, जो इस सर्वेक्षण में दर्ज नहीं किए गए।
A sentence landed in my inbox on a September morning: according to a FIDE survey, three in four female chess players have faced gender bias or harassment at some point in their careers. My notebook has had one rule since 2026 — no prevalence statistic gets recorded until I have the sample size, the fielding dates, and the actual wording of the question. That morning, none of the three were present.
The number is 75 percent. It should startle. But what stopped me was not the number; it was the empty frame around it. In the material I can reach, there is no named player, no tournament, no national federation, no fielding date, no link to a primary document. The second "information point" travelling alongside it is a website's privacy-and-cookie notice — boilerplate with no chess content whatsoever. That is itself a signal: the page was mined by a scraper, not edited by a human.
I am not dismissing the figure. I am fixing its status: an unverified, directionally solid claim whose real value sits not in its precision but in the empty space surrounding it. And because it is a prevalence figure, its shelf life is roughly six to eighteen months, while the news peg lasts days. That gap tells you where the reporting will hurry and where the analysis should stall.
Context: an institution running on three different clocks
FIDE's institutional dates on women's chess run long. Since 2026 the Women's World Championship has run on a separate cycle, beginning with Vera Menchik. A separate cycle has never meant parity; it has meant that top women play inside two structures at once — the open circuit and a separate title ladder. Administratively that is clean. Culturally it is double work.
Look at the rating gap. The top women have generally sat in the 2550–2600 band while the world number one has sat around 2830+ — roughly 230–280 Elo. These are my approximations, date-sensitive, verification pending; I am not writing them as settled fact. The title ratio speaks more plainly: fewer than 50 women have ever held the full Grandmaster title, under 2 percent of all GMs.
After 2026 the sport's economics changed. ChessBase India solved the reach problem — video first, text after. In 2026 the first Tata Steel Chess India was held in Kolkata, in a summer when Russia's football World Cup was eating every sports desk's travel budget and I covered it on my own money. That June, Kolkata spoke the World Cup as a second language — on the street, in taxis, in hotel lobbies. That same month Praggnanandhaa became India's youngest grandmaster at twelve, and I built the first org chart of the Velammal school pipeline behind him. I bring the same habit to this survey: first ask who paid, who coached, who drove the kid to the hall. A survey is a pipeline too — who writes the questions, who receives them, who answers.
The number and its denominator
The most important part of a prevalence figure is its denominator. Here it is missing (n undisclosed). The arithmetic is simple: if n is around 400, the 95 percent confidence interval on 75 percent is roughly ±4 percentage points; if n is around 100, that interval widens to ±8.5. The headline is directionally robust, its precision unknown. Editors trim the interval; readers quote what remains.
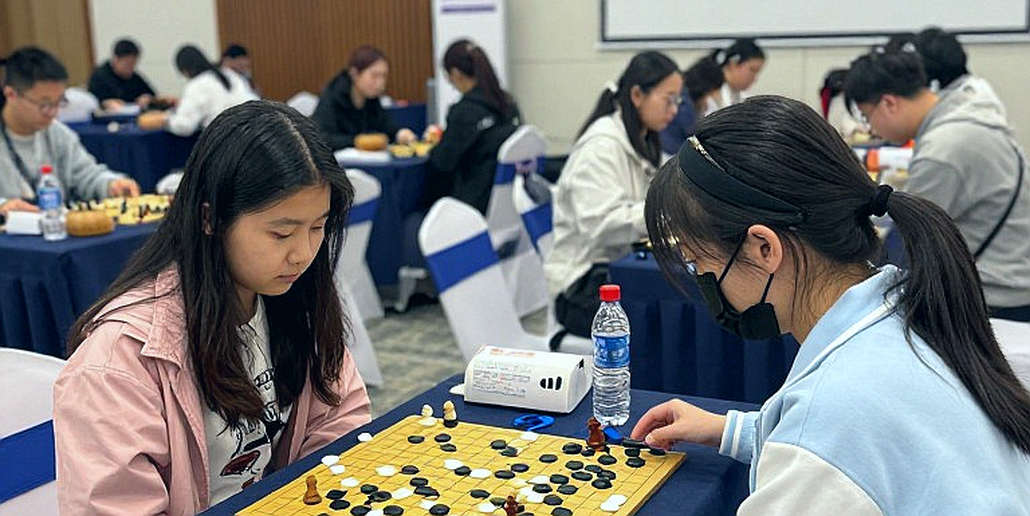
The second and more serious problem is the sample. Surveys distributed through federation and platform channels disproportionately catch the most engaged players — those who play tournaments, exist online, belong to the community. That is precisely the group most exposed to both bias and harassment. Prevalence estimates drawn from self-selected online samples typically run high relative to population estimates. This does not make the number false; it files it under "at least this much," not "exactly this much."
The third missing element is a comparison group. The standard method is to ask male respondents the same question — "have you experienced harassment in chess?" — so that a gender-specific effect can be separated from the sport's baseline culture. Without it, 75 percent is a lone point that cannot be placed on any axis.
And the fourth, the most damaging: categories merged. The headline says "bias or harassment" — a disjunctive question. Bias is a very wide category; it can include someone assuming, mid-explanation, that you will not follow the position. Harassment is a different category, conduct that in some cases may be criminal. Folding the two into one percentage denies organisers the information they most need: are they facing a culture problem or a safety problem? The first is treated with training, arbiter standards and evaluation process; the second with reporting channels, investigation and removal. One number cannot prescribe both, and that is this survey's biggest strategic weakness.
The part no headline will carry
I drew the decision nodes first, then I watched the match — a habit that came from a 7,000-word draft on the 2026 Carlsen–Karjakin tiebreak that I rewrote eleven times. Applied here: there is no game-level analysis at all. No game, no opening, no evaluation, no time control. Anyone extracting a technical read from this story is inventing one.
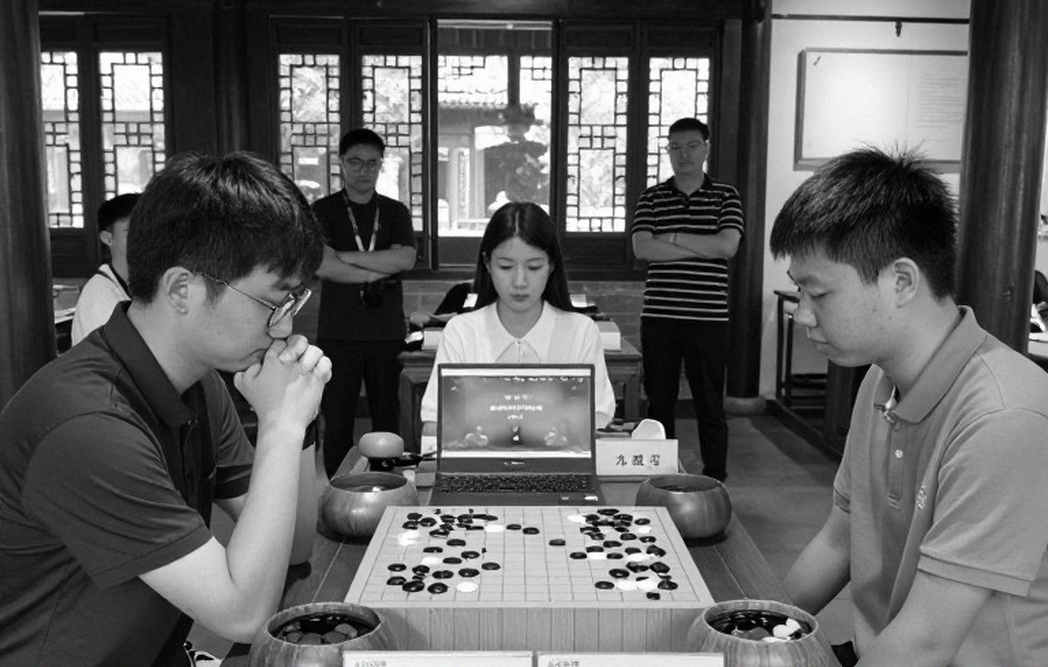
But there is one real, unmeasured channel. Sustained exposure to bias or harassment degrades performance along three routes: distraction during preparation, fractured concentration under time pressure, and most importantly event selection — declining invitations, avoiding certain venues, withdrawing from mixed open sections. The mechanism is well documented in other cognitive-competition domains. In chess nobody has measured it, so I write it at low confidence.
The measurements that should exist and do not: withdrawal rates by gender, participation continuity across a cycle, error rates under time pressure, dropout by age band. Without them, 75 percent remains a sentiment metric, not a performance metric. In sports-science language, the survey recorded the symptom, not the load.
Contrarian angle: the missing strata matter more than the missing n
People will say the biggest omission is the undisclosed sample size. I disagree. The bigger omission is that the figure is unstratified. It cannot separate elite from amateur, over-the-board from online, one region from another. For a policymaker, knowing which group needs which intervention is worth more than n. Without strata, 75 percent is an average that applies nowhere in particular.
The second contrarian point fewer will raise: much harassment in chess today happens online — platform chat, direct messages, social media. If the survey folded over-the-board and online experience into one question, FIDE is publishing data on conduct it cannot police within its own jurisdiction. That is not the institution's error; it is the boundary of the governance structure — and that boundary says the next move belongs at platform level, not federation level.
The third: the direction of the reporting rate. In a small, tightly networked professional community, the most severe conduct is the least recorded, because coaches, arbiters and organisers are the gatekeepers — a complaint must climb the same ladder the career does. Which means 75 percent is plausibly a floor. This argument raises the number rather than lowering it, and that is exactly why it needs the methodological note attached, or it will be quoted as a static fact for two years while prevalence and reporting norms both drift.
I learned that lesson expensively in 2026. It was the empty-hall year; I moved a study on time-pressure decision-making online and modelled what I called "screen-rating drift," the gap between online and classical Elo. In August the FIDE Online Olympiad final broke on server failures and India and Russia were declared joint winners. I wrote then that selectors would mistake online form for classical form. Two federations, I later learned, had already circulated my spreadsheet. The lesson held: no statistic gets quoted without sample, platform, time control, rating pool. The evaluation bar moved before the player did; here the bar never moved, because the pieces were never set on the board.
What to watch
Three things over the next two weeks. First, whether FIDE's primary document becomes public — with the questionnaire, not just the headline. If the question wording surfaces, we learn whether "bias or harassment" was one disjunctive prompt or two questions merged afterwards. Second, whether a policy package arrives with the number or only a press release. Institutions publish data for two reasons: to answer a scandal, or to justify a coming policy. Here there is no named player and no specific incident, so the second is the stronger likelihood. Third, and hardest, whether the next cycle produces the proxies this survey lacks — walkover rates by gender, participation continuity, dropout by age band.
75 percent is the number everyone will quote. The real question is the empty column beside it, the one where a denominator should have been written.